The email address in "Contact AK: Ads and more" above will vanish from November 2018.

PRIVACY POLICY

FAKE ASSI AK71 IN HWZ.

Featured blog.

1M50 CPF millionaire in 2021!

Ever since the CPFB introduced a colorful pie chart of our CPF savings a few years ago, I would look forward to mine every year like a teena...

Past blog posts now load week by week. The old style created a problem for some as the system would load 50 blog posts each time. Hope the new style is better. Search archives in box below.

Archives

"E-book" by AK

Second "e-book".

Another free "e-book".

4th free "e-book".

Pageviews since Dec'09

Financially free and Facebook free!

Recent Comments

ASSI's Guest bloggers

Charts in brief: 4 Jun 10.

Friday, June 4, 2010

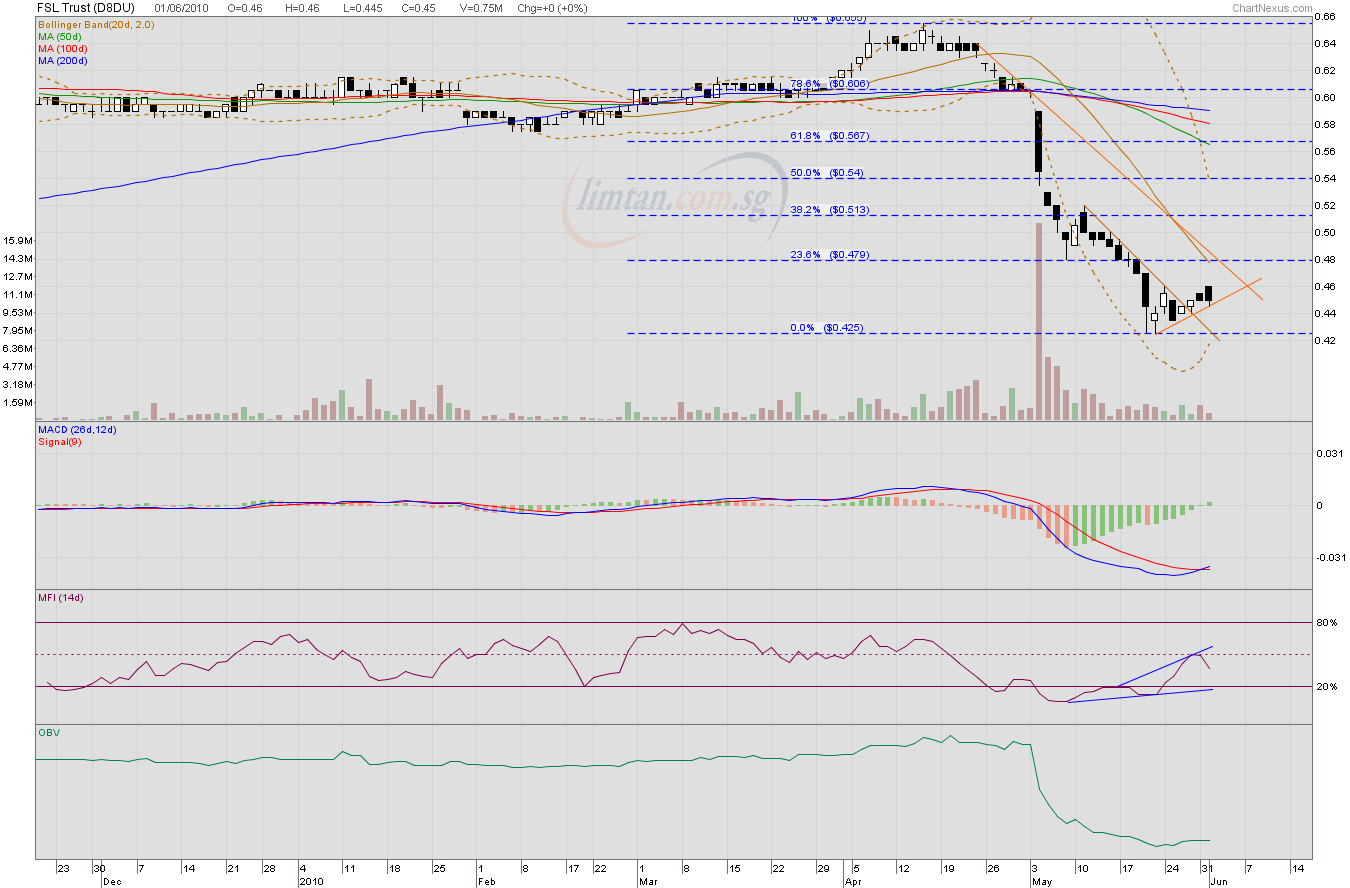
FSL Trust: Bought some units at 45.5c today.  Volume shrank as price closed at 46c.  46c is still the resistance to watch. A semblance of stability has returned to this counter but its price is probably not going to rise in a hurry. MACD continues to rise above the signal line and MFI is testing 50% once more.


LMIR: Price closed at 47c above the 20dMA on low volume. We need confirmation that the 20dMA is resistance turned support. 47c is a many times tested support and should provide resistance.  I have sold some units at 47c to reduce my exposure. Next resistance level is at 48c which approximates the positions of the 50dMA and the 200dMA. The downtrend is still intact.


AIMS AMP Capital Industrial REIT: 22.5c. Very low volume. MACD has crossed into positive territory and MFI continues to rise above 50%. OBV has flattened at a high. I continue to queue to sell some at 23c, the top of the range.


Golden Agriculture: A doji formed today on very low volume. The downtrend is intact even as the MACD forms a bullish crossover with the signal line in negative territory. A lower high in the MFI tells of weak positive buying momentum. I have sold into strength and will wait for clearer signs of bottoming before going long again.


SPH: Volume continues to fall as price formed a white spinning top today, resisted by the 20dMA at $3.79. OBV is flat. MFI is moving to test 50%. The negative divergence between rising price and falling volume is quite clear to see (as with many other counters). I would like to to sell some SPH shares at $3.83 but without volume, it seems difficult.


Related post:
Charts in brief: 3 Jun 10.

Charts in brief: 3 Jun 10.

Thursday, June 3, 2010


AIMS AMP Capital Industrial REIT: There is no doubt now that this counter has cleared a major resistance provided by a cluster of MAs. Closing at 22.5c today increased the probability of a retest of 23c, a long term resistance.  Would it stay range bound with 23c as the upper end of the range? The MACD is rising strongly and looks set to cross into positive territory which would signal the return of positive momentum. MFI is rising and OBV is rising.  The momentum seems strong.


FSL Trust:  Volume expanded nicely today on a white candle day.  The declining 20dMA is growing gentler in its gradient.  MACD continues to pull away upwards from the signal line in negative territory. MFI formed a higher low as it moves to test 50% again.  OBV is rising. The Bollinger bands are narrowing which suggests a reduction in volatility. 46c remains the resistance to watch for now. The declining 20dMA is at 47c.  Clearing these resistance levels could possibly see a target of 51.5c.


Golden Agriculture: Price touched a high of 52c after overcoming resistance at 50.5c. 52c, incidentally, is also where we find the declining 20dMA.  I have sold my remaining shares in this company at 51c. The negative divergence between rising price and falling volume is quite clear.  The downtrend is still intact and this rebound has provided me with an opportunity to divest.


SPH: Very nice white candle day but the volume has declined. Negative divergence.  Not so nice. MACD is poised for a bullish crossover in negative territory.  MFI has formed a higher low but OBV is flattish.  Closing at $3.79 is where we find the 20dMA.  Breaking this resistance, I believe, will find resistance at $3.83 next as this is where we find the 150% Fibo line as well as the 100dMA. Breaking this level would find resistance higher up at $3.88 and $3.90. Without an expansion in volume as price moves higher, I am doubtful that the higher resistance levels could be taken out and would therefore sell into strength.


Related posts:
FSL Trust: Time to buy?
AIMS AMP Capital Industrial REIT: A strong up day.
SPH: Flirting with the 200dMA.
Golden Agriculture: Downtrend is intact.

Charts in brief: 2 Jun 10.

Wednesday, June 2, 2010

Healthway Medical: Closing at 16c today is probably a relieve for shareholders of this company. 16c is where we find the flat 100dMA.  16c is also a many times tested support and likely to be a strong resistance. So, it remains to be seen if this could be taken out.


Volume has been thin and any upward movement in price is not convincing, therefore. Personally, I would sell into strength, especially if price continues to appreciate. Sell some at 16c and sell more at 17c? Maybe.

LMIR: A low volume day as the MACD crossed above the signal line and price closed at 46.5c, approximating the declining 20dMA. Volume has been declining as the price staged a rebound from a recent low of 42c. I would continue to queue to sell some at resistance as a hedge. I see a band of resistance from 47c to 48c.


Related post:
LMIR: Up against a wall?

Golden Agriculture: Downtrend is intact.

Tuesday, June 1, 2010

I have a very small long position left in Golden Agriculture, having divested half of my remaining investment at 55.5c in mid May as the counter formed a lower high in the current downtrend which started in late April. It has continued to form lower lows and lower highs since.


The immediate resistance seems to be 50.5c now while breaking the low of 24 May would have a downside target of 44.5c as suggested by Fibo lines which coincides with gap support formed on 9 Nov 09.  That is some way to fall.

I am definitely not in a hurry to add to my long position at this point in time.

SPH: Flirting with the 200dMA.

SPH has been flirting with the 200dMA in the last few sessions. Today, it closed firmly below the 200dMA, forming an inverted white hammer, at $3.69.  I am watching this counter very closely as it is my favourite blue chip for its high yield and fortress-like core business and real estate interests. Also, I have divested about half of my investment in this company at $3.95, a lower high, in an earlier session after it hit a high of $4.18 in late April. So, I would like to load up again in order to keep my portfolio balanced.


Seeing how the 200dMA is in danger of being left behind, I plotted Fibo lines which suggest that price could go as low as $3.52 which coincides with the lows formed in the first half of Nov 09.


If we look at the weekly chart, we see that the rising 50wMA has not been compromised as a support.  It is at $3.63 this week. I might buy some at $3.63 as a hedge.

CapitaMalls Asia: Dicey.

For three consecutive sessions, the downtrend resistance line has been tested and broken. Today, it seems that price has closed above this line at $2.11 while being supported by the 20dMA. The bugbear is, of course, the negative divergence between the rising price and the falling volume. If volume does not expand meaningfully as price increases, any further upside might be capped by the declining 50dMA.


Where the momentum oscillators are concerned, the MFI has been forming higher highs and higher lows, suggesting rising buying momentum. The MACD is rising and has stayed above the signal line which is promising although it is still in negative territory. The OBV is not as encouraging and is flattish.  All these technicals combined with the price action forming higher lows and lower highs which create a symmetrical triangle suggest caution to be exercised when going long here.

Any continuing move upwards would be met with resistance in a band from the 50dMA at $2.17 to $2.19.  Without a meaningful expansion in volume, it is unlikely that this resistance band would be overcome. Further downside should find initial support at $2.03, provided by the uptrend support.  Until the symmetrical triangle resolves itself to have price go either up or down, the situation remains dicey.

FSL Trust: Time to buy?

FSL Trust has moved above its most recent downtrend resistance on 27 May and has established an uptrend support since it bottomed at 42.5c on 21 May with a white spinning top.  That white spinning top has delivered as a reversal signal, it would seem.

The MACD has crossed above the the signal line in negative territory.  MFI has formed a higher high after being resisted at 50%.  OBV has stopped declining.  All the technicals suggest that downward pressure has eased and that its price might now be basing.


Should we buy some now? As a hedge, maybe. We have to bear in mind that price has been rising recently on very low volume.  If price starts declining again soon, we would have a lower high formed and we want to see that 42.5c is not tested again (in which case, it would form a higher low) or, if it is tested, it should hold up (in which case, it might form a double bottom).  If 42.5c breaks as support, a new lower low would be formed, which is bearish.  Then, the MACD's bullish crossover in negative territory would have just been signalling a rebound and not a more bullish reversal.

So, I might hedge with a smallish long position but I would only buy more if I see clearer signs that price has bottomed and that it is recovering.

Related posts:
FSL Trust: A sinking ship?
FSL Trust: That sinking feeling.

LMIR: Up against a wall?

Monday, May 31, 2010

LMIR staged an up day as well but on rather lacklustre volume. Price hit a high of 47c before retreating to close at 46c. 47c is a many times tested support and could be a strong resistance now.  For those who wish to, it is a good price to reduce exposure at. Price could touch a high of 47.5c for this REIT tomorrow and the downtrend would still be intact.

However, the momentum oscillators are encouraging with MFI forming a higher high and the OBV continuing to rise. The MACD looks like it would do a bullish crossover with the signal line in negative territory.  Let's see what tomorrow brings.


My strategy in a downtrend: Sell into strength as price rebounds to test resistance. Buy more when price shows signs of bottoming or when the trend shows signs of reversing. Bearing this in mind, I would queue to sell some at 47.5c, the trendline resistance, tomorrow

AIMS AMP Capital Industrial REIT: A strong up day.

AIMS AMP Capital Industrial REIT staged an impressive up day on high volume today.  It has been a long time since this REIT has had a white candle day on such high volume. Immediate resistance provided by a confluence of MAs was taken out at 21.5c as it closed unequivocably at 22c.  There were quite a few big trades today:

9.07 AM at 21c, 1,086 lots bought up.
9.28 AM at 21.5c, 1,185 lots bought up.
11.59 AM at 22c, 1,821 lots bought up.

It is my guess that this REIT has attracted the attention of more funds and big time investors. Something might just be brewing. The OBV is rising strongly, a sign of heavy accumulation.  The MFI is rising towards 50%, a sign of positive buying momentum.  The MACD has turned up sharply towards the signal line, ready for a bullish crossover in negative territory. Unless the MACD crosses upwards back into positive territory, what we have today could just be a rebound although the very high volume is encouraging.


A further upmove in price should test 23c, a many times tested resistance level, once more. Is this REIT going to move up out of its trading range finally?  Only time will tell. 

My strategy in a rangebound situation: Sell into strength at resistance and accumulate on weakness at support.  I sold the units I collected at 20.5c last week at 21.5c resistance for a quick gain today.  I am queueing to sell more at 23c, the top of the trading range, tomorrow. 23c is a long term resistance and would be harder to overcome. If I do manage to sell more at 23c tomorrow, I would be left with 75% of my original position which I would leave to enjoy any breakout if it should take place. Always hedge.


Monthly Popular Blog Posts

All time ASSI most popular!


Bloggy Award