The email address in "Contact AK: Ads and more" above will vanish from November 2018.

PRIVACY POLICY

FAKE ASSI AK71 IN HWZ.

Featured blog.

1M50 CPF millionaire in 2021!

Ever since the CPFB introduced a colorful pie chart of our CPF savings a few years ago, I would look forward to mine every year like a teena...

Past blog posts now load week by week. The old style created a problem for some as the system would load 50 blog posts each time. Hope the new style is better. Search archives in box below.

Archives

"E-book" by AK

Second "e-book".

Another free "e-book".

4th free "e-book".

Pageviews since Dec'09

Financially free and Facebook free!

Recent Comments

ASSI's Guest bloggers

MIIF: Springboarding or diving?

Saturday, September 25, 2010

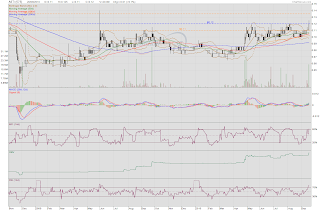
The question I have now is whether MIIF is going through a correction using time, waiting for the 20dMA to catch up before moving higher in price. The 20dMA is fast approaching 54.5c and to any chart watchers, it is quite obvious that this price is the immediate support.


The Bollinger Bands look like they are in the early stages of squeezing, signalling the onset of lower volatility and a possible springboarding (or diving) of MIIF's unit price to come. The OBV has been continually moving higher while the MFI is approaching 50% which could serve as support.  RSI suggests that the buying momentum has weakened but the MFI which takes into account volume as well shows that demand has been rising.

If the immediate support at 54.5c should give way, the next support is at 53c, a many times tested resistance level.  This is where the 50dMA is approximating as well.  Strong support is at 51c which is also where the rising 100d and 200d MAs would be in time.

Golden Agriculture: Stay cautious.

Golden Agriculture's share price made a successful attempt in recovering lost grounds as price opened at 57c and closed at 58c, forming a white candle on rather low volume in the last session.  Given the lack of enthusiasm in the upmove, one wonders if there would be a follow through which would see the 20dMA at 58c taken out as the immediate resistance.


The MACD continues to move lower after completing a bearish crossover with the signal line. MFI and RSI have both formed higher lows which is encouraging.  OBV is flat.  Technically, there isn't any clear direction.

Fundamentally, CPO price has stayed above RM2,700 and Golden Agriculture should be a strong beneficiary of this.  However, with the recent bad press and uncertainty as to whether things would worsen, it might be better to err on the side of caution and to stay sidelined. Support provided by the 100d and 200d MAs could be a better entry point and that is currently at 55c.

Related post:
Golden Agriculture: Unable to break out.

Buy more silver on weakness.

On 7 February 10, I mentioned that "Silver is a real asset, with real value, just like gold, as its supply is finite.  Fiat currencies, on the other hand, do not have any intrinsic value and more could be produced at will.  So, we expect silver to at least keep pace with inflation and in an inflationary environment, an investment in silver should protect our wealth from being eroded."


In that blog post, I mentioned that my research showed that silver was very undervalued and was trading at the higher end of the Gold:Silver ratio since 1980.

At that time, silver was US$15.15/oz while gold was US$ 1,052.20/oz.  It was just reported by Bloomberg today that "Gold for December delivery was 0.2 percent higher after reaching US$1,299.70 an ounce on the Comex in New York. Silver for immediate delivery in London climbed as much as 1.2 percent to US$21.3875 an ounce, the highest price since October 1980." Read article here.

Silver has gone from US$15.15 to US$21.38 an oz.  This is a gain of 41% in slightly more than 7 months.  Gold has gone from US$1,052.20 to US$1,299.70 an ounce.  This is a gain of 23.5% in the same period.  An investment in either one of these precious metals would have been very rewarding but silver has obviously outperformed gold by a large margin.

I am glad I bought some silver and I would like to buy more silver on weakness when the opportunity presents itself as I continue to believe that having some investment in precious metals is an essential part of anyone's portfolio. Silver is a laggard in the realm of precious metals and it is just catching up.

Do I have a target price for silver? Silver reached its peak in value on 15 January 1980 when 1 oz of gold could purchase only 14.9 oz of silver.  Based on today's price of gold at US$1,299.70 an ounce, it would mean US$87.22 an ounce for silver!  Mind boggling, isn't it? That would be 4 times higher than the current price!  Of course, I am not suggesting that silver would hit that price anytime soon, if it does go that high at all. I am merely putting things in perspective. Remember where the price was in February? Good luck.

A new record! Gold prices struck a record $1,300.07 an ounce in afternoon trade on the London Bullion Market as investors sought a safe haven for their money amid increased uncertainty over the global economic outlook. Silver, meanwhile, jumped to $21.44 an ounce . Published: 5:44PM BST 24 Sep 2010 - Read article here.

Related posts:
Gold or silver?
Gold nearing US$1,300 an ounce.

FCOT, CCT and K-REIT.

Friday, September 24, 2010

I got a SMS from the blog master of Time to Huat as I was on my way home. FCOT's volume surged as price action formed at nice white candle, closing at 15.5c, overcoming a many times tested resistance at 15c.

Buy signal seen on the MACD histogram, higher low formed on the MFI, OBV spiked and RSI rose into overbought territory. Momentum is positive, demand is strong, accumulation is strong and buying momentum is positive but it could be overdone.

Any reason for the optimism in FCOT? I did not see any announcement by the management which could have resulted in such an upmove in price today. Should we buy some? Could it go higher in price?  From a technical perspective, it does look promising.  Volume is, after all, the fuel that drives rallies and today's volume was impressive.

Let us look at the fundmentals:

FCOT's NAV/unit stands at 26c.  If all the CPPUs were converted, NAV/unit would be 25c. So, at a price of 15.5c, FCOT's units are trading at a 40% discount to NAV.  That's pretty steep.

Gross borrowings as a percentage of total assets (aka the gearing level) is at 40.4%. This is rather high and there is limited room to leverage up for any yield accretive purchases.  However, the 342,500,000 CPPUs have a conversion price of S$0.2369 per unit.  This would bring down its gearing level marginally and give FCOT more capital (S$81.138m) to fund yield accretive purchases in future in case all CPPUs were converted. 

The 3Q DPU was 0.25c. So, the annualised DPU should be about 1c. Based on today's closing price of 15.5c, the yield is 6.45%.  This is not very attractive if we were to compare to what we could get from AIMS AMP Capital Industrial REIT, for example.  Of course, these two REITs are in different real estate sectors.  Let us compare FCOT with CCT and K-REIT instead. 


CCT closed at $1.47 today. NAV as of 30 Jun 10 at $1.36. CCT is trading at a 8% premium to NAV. Gearing ratio is at 32.8%.  Plenty of room to leverage up for further yield accretive purchases. 1H DPU was 3.9c.  So, the annualised DPU should be about 7.8c.  This means a yield of 5.3% based on today's closing price. The yield might be lower than FCOT's but CCT has a much stronger balance sheet.

K-REIT closed at $1.31 today. NAV as of Jun 10 at $1.47. K-REIT is trading at an 11% discount to NAV. Gearing ratio is at 15.2%.  This is very attractive to me as it gives the REIT plenty of room to leverage up for potential yield accretive purchases. 1Q 2010 DPU at 1.33c.  Annualised DPU should be 5.32c which means a yield of only 4% based on the current price of $1.31.  K-REIT has, arguably, the strongest balance sheet amongst the three office property REITs discussed here.  The low yield might put off investors but its low gearing paves the way for future acquisitions which could bump up its DPU.

I have told my friends before that for me to buy more units in FCOT, it has to offer me a much higher yield. The much higher gearing and lower quality assets compared to CCT and K-REIT are justifications. There is also greater safety in CCT and K-REIT as their interest coverage ratio (ratio of year‐to‐date earnings before interest, tax, depreciation and amortisation to interest expense) are at 3.8x and 3.6x respectively while FCOT's ratio is at 2.74x.  There is little doubt that FCOT's fundamentals are the weakest of the three. So, naturally, a higher yield is necessary to compensate for higher risk.

See FCOT's presentation slides here.
See CCT's presentation slides here.
See K-REIT's presentation slides here.

Saizen REIT: Emphasis of matter.

Thursday, September 23, 2010

Emphasis of Matter
 
Without qualifying our opinion, we draw attention to Note 1 of the financial statements. As at 30 June 2010, the Group has interest-bearing borrowings of JPY7.8 billion, which are due for repayment within the next 12 months from the balance sheet date, of which the Group expects
to repay JPY0.7 billion with cash generated from operating activities. The Group is currently in negotiations with financial institutions to refinance JPY7.1 billion of these borrowings, which are held by a subsidiary Yugen Kaisha Shintoku (“YK Shintoku”) and have been in default since November 2009. The Group has also implemented a plan to divest some properties of YK Shintoku to reduce the borrowing amount with approval from the lender.
 
In accordance with the loan agreement of YK Shintoku, the lender has the right to take control of YK Shintoku in the event of default. As at 30 June 2010, the net asset value of YK Shintoku amounts to JPY2.0 billion, which approximates 8.6% of the net assets of the Group.
 
The subsidiary’s ability to continue as a going concern is dependent on the successful outcome of these refinancing negotiations with financial institutions and support from the lender by not seeking foreclosure of the assets of the subsidiary within 12 months from the balance sheet date. These conditions indicate the existence of a material uncertainty, which may cast significant doubt on the subsidiary’s ability to continue as a going concern. If the subsidiary is unable to continue in operational existence for the foreseeable future, adjustments would have to be made to reflect the situation that its assets may need to be realised other than in the normal course of business and at amounts which could differ significantly from the amounts stated in the balance sheet. In addition, the subsidiary may have to provide for further liabilities which may arise. The Group’s financial statements do not include the adjustments that would result if the subsidiary was unable to continue as a going concern.

PricewaterhouseCoopers LLP
Public Accountants and Certified Public Accountants
Singapore, 22 September 2010

Saizen REIT's manager has reiterated that the loan of Yugen Kaisha Shintoku (“YK Shintoku”) is non-recourse loan and is not cross-collateralised, and there is also no cross-default in respect of the loans of the other subsidiaries of Saizen REIT. Given its non-recourse nature, the decrease in the net asset value of Saizen REIT and its subsidiaries (the “Group”), in the worst case scenario of a foreclosure of YK Shintoku, will be limited to the net asset value of YK Shintoku (which amounted to JPY 2.0 billion, or 8.6% of the Group’s net assets, as at 30 June 2010).

In some of my earlier blog posts, I looked at what would happen if YK Shintoku should suffer foreclosure.  

In one blog post, I mentioned: "If YK Shintoku were to suffer foreclosure, the nett effects would be a 22% decrease in nett property income, a 10% reduction in NAV and its gearing level would decline from the current 36.9% to 27.4%.  

"Based on the current number of units in issue, the DPU would reduce from 2c to 1.56c giving us a yield of 9.45%.  The NAV would reduce from 39c to 35c approximately.  With the proforma foreclosure gearing at 27.4%, Saizen REIT would emerge unscathed and, in my opinion, stronger in its balance sheets. So, if YK Shintoku goes through a foreclosure, Saizen REIT remains a great investment as it has high yield, a big discount to NAV and low gearing."

Related posts:
Saizen REIT: 3Q FY2010 Results.
Saizen REIT: Better than expected DPU.

Golden Agriculture: Unable to break out.

Golden Agriculture was unable to breakout of resistance at 60c which was presented by the resistance line of the symmetrical triangle identified some time ago. On 20 Sep, I mentioned that "the MFI and RSI are both bordering on overbought and OBV is flat. Technically, the picture is not strong."  Today, price closed at 57.5c which is the immediate support provided by the rising 50dMA and it is also a many times tested support.


What is consoling is that the decline is on the back of lower volume.  However, if 57.5c should give way, I expect the next support at 55c which is provided by the merged 100d and 200d MAs and the support line of the symmetrical triangle. The MACD has completed a bearish crossover with the signal line and price could move lower.

With the latest bad press that the Roundtable on Sustainable Palm Oil (RSPO), an industry body of planters, green groups and consumers, had written to Smart and Golden Agri censuring the firms for the breaches uncovered by an audit, the share price of Golden Agri could face downward pressure and a retest of support at 55c is probable.

Related post:
Golden Agriculture: Which way would it go?

Hope this helps to refresh your "A" Level Economics!

The title of this blog post is exactly the same as the title of an email sent to me by a reader, Paul.  I like how it neatly encapsulates his good intention with a dash of cheekiness. I try not to take myself too seriously most of the time. Haha... I have reproduced his email with his permission:

Ways to Boost National Income

As we have learnt in basic economic theory, C+I+G+(X-M)=Y, I will now discuss issues which are restricting the major economies such as US and the EU to grow, and some of the policies which have been undertaken by them.

C stands for domestic consumption. In recessions, consumption is usually hit badly. As the consumers are busy deleveraging to pay off their debts, they cut down on their income elastic consumption which is normally the luxury goods.

I stands for investments, aka private sector. During recessions, there is a lack of incentives for investment by the private sector due to excess capacity therein. Furthermore, margins could thin due to lack of pricing power in times of recession. In addition, due to consumers deleveraging, there could be a lack of demand from consumers.

G stands for government spending. In normal recessions, a country's government is able to execute expansionary fiscal policies through spending in sectors such as infrastructure, education, health or military. These deficits could be financed by previous budget surpluses (which many of these big countries do not have), or borrowings through issuance of government bonds. Most countries adopt the issuance of government bonds approach to finance their government spending. However, as mentioned in an earlier post, governments in major economics like the UK, Japan and the USA have been incurring budget deficits for the past few years, which limit their ability to borrow more money. In the case of the US, the government debt is expected to double over the next decades, with majority of the debt caused by interest payment. The austerity program adopted by the major economies limit the governments' ability to prop up growth.

(X-M) is net export. One of the most basic ways to boost the (X-M) component is to have a weaker currency, which would make a country's exports relatively cheaper compared to other countries. Currently, governments worldwide are turning to this as a solution. Instead of focusing on productivity to boost exports, governments take the easy way out, by “manipulating” the strength of their currencies. For example, USA forced the revaluation of the Japanese Yen in 1985 to boost their exports. Currently, USA is trying to do the same to the Chinese RMB.

In this world, there is never a case of a balanced trade accounts, there will always be imbalances, some countries having surpluses, some having deficits. Trade account surpluses and deficits are not a problem in economic studies. But for political reasons, it has been a problem. Recently, Japan central bank also intervened in the FOREX market to weaken the yen. This has led to what is called "competitive devaluation", a race to the bottom, where countries will try to make their currencies relatively weaker to boost exports.

Another method to boost (X-M) is the implementation of trade barriers, which would again result in trade wars. Already, there are signs of protectionist measures in the USA through the “Buy Made in US” campaign. Trade wars would hamper global economic growth, especially those of emerging markets which are reliant on exports.

When there is a recession caused by a financial crisis, it takes longer than usual to recover due to the freeze in credit lines and financial system. Actually, US is doing comparatively better than the recovery from previous financial crisis led recession.

In the case of Singapore, we are fortunate enough to have a good public financial system. Any sales of Singapore assets such as land are being kept in the “treasury” under the care of the President and not the government. 50% of the returns from investments such as those from GICs are also channeled into this “treasury”.

Hence, when the Singapore government want to tap into this reserve in 2008 or 2009, it had to seek permission from the President. The budget surpluses which are usually stated by the government, do not include the increase in the reserve funds. Therefore, “short term pain, long term gain” has served Singapore well in saving for the rainy days and having the fiscal policies to help the economy. Most western economies do not have this privilege due to the asymmetrical nature of fiscal policies. Easy to cut taxes, hard to raise taxes, which sort of validate Singapore government's stand on retaining the GST even during the economic hard times.

Related post:
USA, a rock and a hard place: Paul opines.

Bribing a Malaysian cop (UPDATED JULY 2018).

I just came back from a day trip to Johor recently and this was one of the things we talked about.

Singaporeans are a fortunate bunch but being in Singapore most of the time also makes us sheltered and somewhat naive.

Just look at the number of Singaporeans who got scammed in the years past, for example.


--------
I just read that "A Singaporean man has been sentenced to a day’s jail and fined S$4,300 (RM$10,000) for attempting to bribe a Malaysian traffic policeman with S$21 (RM$50)."

I remember how almost 10 years ago, I exceeded the speed limit on the North South Highway by some 20km/hr and was caught in a speed trap.  


The police officer smiled at me and told me I was speeding.  

He asked for my driver's license and I gave it to him.  

He did not proceed to issue me with a speeding ticket but continued smiling at me.  

I looked at him and asked him how much was the fine.  


He looked puzzled and looked at a chart and told me RM200 (thereabouts), if my memory serves me right.  

I just said "OK, please give me the ticket".  

His smile went away as he issued a speeding ticket.


My friend who was in the car with me gave me a scolding after I drove off.  

"Couldn't you see he was waiting for you to bribe him?" 

and 

"You could have settled it with just RM50!"  


I simply replied that I always do the right thing or try to anyway.  

I got another scolding when I spent a couple of hours the next day trying to locate a police station in Klang to pay the fine.  "See how much time we have wasted?"  

It didn't help that the policeman on duty was dozing and the receipt was manually issued which took an inordinate amount to write.


A couple of years later, my dad drove the same car into Malaysia and was stopped by a policeman who claimed that the fine was never paid!  

My dad called me on the phone then and I told him that I laminated the receipt and he would find it in the glove compartment. 

I had taken precaution just in case something like that happened. 

It's Malaysia. 

Malaysia boleh!

(You have to watch the video by ABC NEWS.)


This Singaporean guy who was trying to bribe the traffic policeman, if you asked me, was just "suay" (bad luck) since what he tried to do is something which many (Malaysians and Singaporeans) have always done and are probably still doing.  

The Chinese have a saying: 

"Kill the chicken to show the monkeys".  

He happened to be the chicken in this case.


Read the full story here.

Gold nearing US$1,300 an ounce.

Wednesday, September 22, 2010

Gold is currently at US$1,293.50 an ounce and silver is at US$21.05 an ounce, even higher than just a week ago when I said "I see immediate support for gold at US$1,260.00 an ounce and immediate support for silver at US$20.20 an ounce.  Gold is now challenging resistance at US$1,270.00 and if it does break this, it could go much higher."

The Fed seems ready to increase liquidity in the US economy and this could possibly cause the US$ to depreciate further. What this might translate into is greater inflationary pressure in the USA in time and I have been a staunch believer of this eventuality as informed by Dr Marc Faber and Mr. Jim Rogers.

The worst thing to invest in would be the US government bonds (treasuries) as bondholders would basically be seeing their wealth eroding away as the US$ depreciates in value.  This is precisely why the Chinese government is so concerned since they are the world's largest holder of US$ debt, after Japan. However, in the short term, they could see bond prices bumping upwards because the Fed would buy bonds to keep interest rates low in an effort to encourage borrowing by the private sector.

Could gold go much higher?  It is my believe that it would but it would not be a straight line up.  The real value of gold is closer to US$2,000 an ounce and this would take time to materialise. So, for anyone who is thinking of having some exposure to the precious metal, it is my opinion that buying on pullbacks as supports are retested would be the way to go.

Related posts:
Gold and Silver highest in the last 12 months.
Real value of gold.

K-REIT: Volume expansion.

Just yesterday, I mentioned that "the attempt to move higher in price was on the back of relatively low volume.  In fact, we could see a negative divergence between price and volume clearly.  Price is rising on lowering volume.  Not too promising." and "Of course, things could look much rosier if we have an expansion of volume the next day while price moves higher. TA is only about probability after all."  Well, today, volume expanded significantly.  In fact, it expanded so much that it negated the negative divergence observed yesterday.  The buy signal on the MACD histogram delivered the goods and proved the skeptic in me wrong.


OBV has climbed sharply indicating strong accumulation activities while the MFI rose towards overbought territory.  Demand is strong but the fact that there is a long upper wick in today's white candle suggests the presence of some selling pressure beyond $1.30.  Looking at today's trade summary, however, we find that of 4,334 lots traded, almost half of these (2,164 lots) were buy ups at $1.32.  If this buying momentum continues, we could see price moving higher.  Expect $1.33 to be the immediate resistance although it could be a weak one if the buying momentum continues. Immediate support at $1.28.

Related post:
K-REIT: Moving into the next band?

K-REIT: Moving into the next band?

Tuesday, September 21, 2010

On 14 Sep, I suggested that "K-REIT seems to be trading in a 6c trading range recently: $1.16 to $1.22 and $1.22 to $1.28".  I also said "in the event that $1.28 resistance is taken out, one could therefore expect $1.34 to be the next resistance level."

Today, K-REIT traded at and above $1.28 the whole session.  It touched a high of $1.30 before closing where it started the session at $1.28, forming a gravestone doji.  The sell queue at $1.30 is formidable. Could $1.28 be the new support?  Frankly, a gravestone doji does not inspire much confidence.  Furthermore, the attempt to move higher in price was on the back of relatively low volume.  In fact, we could see a negative divergence between price and volume clearly.  Price is rising on lowering volume.  Not too promising.


However, OBV shows accumulation mode in full swing.  MFI is rising gently and not overbought.  RSI is however in overbought territory and suggests that buying could be overdone. Very interestingly, the MACD histogram has turned green, a buy signal but notice that the distance between the MACD and the signal line has been narrowing.  So? Caution.  It would not be a good idea to buy into K-REIT now.

Of course, things could look much rosier if we have an expansion of volume the next day while price moves higher. TA is only about probability after all.  Whether $1.28 is now support needs confirmation.  That there is a strong support at $1.22 has been established earlier.

Related post:
K-REIT: Trading bands.

Courage Marine: White candle day.

On 15 Sep, I asked, "Is Courage Marine awakening? If the resistance at 19.5c is taken out convincingly, it could very much be the case." Today, this took place on rather high volume. Of the 3,882 lots traded today, 2,999 lots were buy ups, of which 2,172 lots were buy ups at 20c.  Could the remaining sell queue at 20c be mopped up tomorrow? Perhaps.


The MACD is rising in positive territory signalling a return of positive momentum. The OBV shows a sharp move upwards suggesting increased accumulation. The MFI formed a higher low several sessions ago and has risen into overbought territory.  The RSI has the same trend.  Demand and buying momentum are both positive but seeing the indices being in overbought territories sends a cautionary note.  Any upside could be limited.  If 20c is take out, the next resistance could be at 21c, the high of 22 Jun 10.

However, in exceptionally bullish situations, both MFI and RSI could stay overbought for much longer. Could it happen in the meantime? It could but it does not seem very probable.

Related post:
Courage Marine: Awakening.

Golden Agriculture: Which way would it go?

Monday, September 20, 2010

CPO price spiked 4.31% today or RM112 to close at RM2,708.  It is on track to challenge the previous high, it seems. Strong buying by Chinese purchasers and short covering were cited as the reasons.

Palm oil shipments to China will likely rise 3% this month compared with August, as low stock levels of around 400,000 tons at ports in China spurred buyers to increase purchases, a Beijing-based vegetable oils analyst said. 
-By Shie-Lynn Lim, Dow Jones Newswires,
September 17, 2010 06:55 ET (10:55 GMT.


Golden Agriculture's share price gained 1c to close at 59c today. This was, however, on the back of rather modest volume. I have suggested in earlier posts that its share price seems to be trapped in a symmetrical triangle. Immediate support is at 57.5c, a many times tested candlestick support and coincides with the rising 20d and 50d MAs. If this goes, 55c should be a very strong support as that is where we find the 100d and 200d MAs.  It is also where we find the uptrend support line now.  To move higher, price has to overcome resistance at 60c.  This is also where we find the upper line of the symmetrical triangle which would present some strong resistance.

Currently, the MFI and RSI are both bordering on overbought and OBV is flat. Technically, the picture is not strong. An appreciation in price on higher volume is required to break resistance at 60c, probably.  However, it would also push the MFI higher into overbought territory.  If this happens, I expect to find strong resistance at 62c.  This is a many times tested resistance level in April 2010 but ultimately proved too strong to be taken out.

Related post:
Golden Agriculture: Trading Buy by OSK.

ASTI: Breakout, almost.

A friend called me and asked if it is too late to buy some shares of ASTI.  Yesterday, I said "I see resistance at 12c which was tested several times in recent months.  It is, however, also interesting to note that we might be seeing the formation of an ascending triangle here with 12c being the top of the formation.  If  the resistance at 12c is taken out, I see immediate resistance at 13.5c with a near term target of 15c." Today, 12c resistance was weakened as price briefly touched 12.5c before ending the day at 12c.  This means that 12c is still resistance and we need to see if it could be taken out in the coming sessions.


So, should my friend buy some shares of ASTI at 12c? Buying at 12c would be buying at resistance. Not a very good idea. However, the very high volume today which accompanied the buy ups is encouraging.  Of the 20,050 lots that changed hands, 15,573 lots were buy ups. 10,369 lots were bought up at 12c.  Could this momentum continue? Let's look at the momentum oscillators for clues.

The MFI has formed a higher low.  So has the RSI.  The MFI is just going into overbought territory while the RSI has spiked into overbought territory.  OBV has also spiked upwards.  Demand is rising. Buying momentum is strong but overdone.  Accumulation is in full swing.  Overall picture looks good.  There is a good chance of a follow through and if it happens, we could see 13.5c tested.  Otherwise, supports could be tested once more. It would be safer to buy in then.

Related post:
ASTI: A doubling of share price in time?

Nil-paid rights and excess rights: Some numbers by LP.

LP, blog master of Bully the Bear, and owner of the infamous cbox therein, has this to share:

I think that people don't understand that the price of the nil-paid rights (right shares that are entitled to you based on your holdings upon XR of the mother share) is priced as this:

Price of mother share - 0.155

If it's lower than the above formula, it opens a chance to arbitrage the difference by buying the nil paid rights or shorting the mother share. Either way, equilibrium will be achieved to bring the price of the nil-paid rights back to the stated formula.

So, if the mother share is trading at 0.225, the nil-paid rights will be priced at 0.07. You pay 0.07 PLUS brokerage to get the nil-paid rights, then you pay at the atm 0.155, so the price will be 0.225 excluding brokerage.

Or on the other hand, if you can buy the nil-paid rights at 5 to 6 cts, you are buying the mother share at 0.205 to 0.215. Good deal to me even if you have to pay brokerage!

If you don't want to do this during the nil paid rights trading period, you can always opt NOT to pay any brokerage and paying 0.155 to apply for excess rights. But you might not get it.

Tea with AK71: Income from blogging.

I have blogged about this before but it is timely that I revisit this topic as JW (aka momoeagle), the blog master of Wealthbuch, took it really hard when Adsense decided to stop working with him recently.  I believe that he would look past this unpleasant episode in his life as a blogger and soldier on in good time. :)

I started blogging out of curiosity and boredom last Christmas Eve and I have been hooked since.  I suppose I really enjoy writing and I enjoy sharing my ideas with people. On 10 March 10, I blogged that "I didn't know I could make money from blogging. However, I did discover quite quickly that there are many ways of making money through a blog."  Adsense, it seems, is the predominant way for most bloggers to derive some income from their blogs.

LP, the blog master of Bully the Bear was one of the first people I made contact with in blogosphere.  He told me how he was unceremoniously banned by Adsense.  Later on, I was told the same thing by my friend and blog master of Time to Huat.  So, you don't see any Adsense ads in their blogs.  So, fearing that I would suffer the same fate, I decided to remove Adsense from my blog.

I enjoy blogging and if I do make money out of it, I consider it a bonus. However, since I do not make much from blogging, it would have a lower priority when compared to other activities which I derive most of my income from.  We live in a world which runs on money.  So, we have to be realistic sometimes, if not most of the time.  The day I could derive an income of mid $X,XXX from blogging every month like some famous blogging personalities in Singapore, blogging might be the only thing I'd do. In fact, I was told that Xiaxue could make $XX,XXX per month from blogging!

The fact is I am a financial blogger and we have a very small niche.  Financial bloggers in Singapore have even a smaller niche. 20,000 pageviews or more a month like Xiaxue's blog?  Not in my lifetime, realistically.  Well, I suppose if I colored my hair like Xiaxue and wrote catchy songs about floods in Orchard Road like Mr. Brown, I could improve my blog's readership numbers. Hmmm, I wonder... Nah.

I can only hope that my readers would visit my sponsors (Nuffnang's ads), give my ZUJI banners a chance when planning to go on an overseas trip and feel generous enough to make a donation (Donate to AK71 pocketmoney fund on the left sidebar) towards my blogging efforts.  So far, I have received small sums of money from all three avenues.  Thank you for the bonus. ;-)

Related post:
Planning to travel? Check out ZUJI.

ASTI: A doubling of share price in time?

Sunday, September 19, 2010

I recently bought some shares of ASTI Holdings Limited.  This company is engaged in the provision of solutions and technologies in the backend (ie assembly, test and finishing) arena of the semiconductor industry as well as the distribution of electronic components and products plus the provision of semiconductor application in consumer electronics, computer peripheral and communication solutions. The description of  ASTI's business is taken from its homepage.

Anyone who knows me well would be somewhat surprised at this move of mine since I am not in tune with high technology at all and IT is as Greek to me as, well, Greek. However, I am not a hermit and I do keep in touch with the real world.  There is much news of how the cyclical demand for semiconductors has been ramping up and that this momentum has yet to run its course.

I read an article in The Straits Times (22 Aug 10) by Tan Ai Teng on why tech stocks are a good buy then:

1. Tech stocks are in a period of strong earnings recovery.

2. The second half of this year would have been stronger if not for a shortage of components.

"I am bullish on the semiconductor equipment related business. According to Semiconductor Association's (SEMI) forecast, global semiconductor equipment sales are expected to climb 104% this year... and rise a further 9% next year."

Since I am so unfamiliar with tech stocks, I was wondering which company's shares offer good value.  As luck would have it, I read an article in Next Insight where NRA reported on Innotek and ASTI.  Both companies seem promising. However, Innotek's share price has appreciated enormously while ASTI seems like a laggard. 

The following factors drew me to ASTI:

1. A share price of 10.5c then with a PER of 3.8x and NTA/share of 16.9c.

2. Improving balance sheet with its gearing level falling from 22% to 8%.

3. Gross margin (GP) expanded from 7.1% to 22% year on year.

Read article here.

As per my usual style, I looked at the chart to find a fair entry price.  ASTI bottomed in late November 08 with price touching a low of 4.5c.  It made a higher low of 6.5c on 16 March 2010. It broke above the 200dMA in April 2010 and has been trading above this MA since. Using candlesticks and the 200dMA as references, strong support at 9c is spotted.  Seeing how the 20d, 50d and 100d MAs are bunching together at around 10.5c, however, I decided to buy some at 10.5c as a hedge.  Price might or might not retest  support at 9c.  If it does not, I'm already in.  If it does, I would buy more as the uptrend is intact.  Looking at the OBV, it is obvious that there is longer term accumulation going on and once all the sellers are done selling, the share price could rise.

NRA has a target price of 21c for ASTI.  That is a 100% upside from my entry price of 10.5c.  Nice but I see resistance at 12c which was tested several times in recent months.  It is, however, also interesting to note that we might be seeing the formation of an ascending triangle here with 12c being the top of the formation.  If  the resistance at 12c is taken out, I see immediate resistance at 13.5c with a near term target of 15c. Over a longer term, we could even see 17.5c, a support level which broke in early 2008, tested.  Of course, in extremely bullish circumstances, prices could go parabolic in which case all resistance levels identified could be destroyed like butter cut by a hot knife. Then, it would be time for me to let go and run for the hills.

Overall, ASTI looks rather promising.  Wish me luck. :)

This video describes how the semiconductor industry may experience shortages due to capacity constraints, increased demand, and low inventory levels (June 14, 2010):

P.S. I am having trouble saving charts from ChartNexus in Lim&Tan. So, I am unable to put up the chart for ASTI here.

Roads to wealth creation in the stock market.

I have a friend who is very risk averse and views the stock market as being fraught with danger. He basically thinks it is a jungle with snake pits and poisonous gas bogs. I am inclined to agree with him which is why it would be most advantageous if we could find a guide who would walk with us.

Having read some personal finance blogs, my friend decided that he wants to try to grow his wealth by investing in the stock market. A commendable change in attitude, if I do say so myself. He wondered if he should try his hands at trading the market and maybe he could grow his wealth quickly that way. I told him candidly that he could make a lot of money that way, the operative word being "could".

I shared with him how I made a lot of money from March 2009 to January 2010.  However, that was a once in a lifetime opportunity to make a lot of money and I was lucky to have participated. Was I smarter than the average investor during the months of March 2009 to January 2010? I don't think so. I was probably just at the right place at the right time. I also told him how I lost a lot of money as well prior to the aforesaid winning streak. So, to me, it's quite simply all about timing.

I told him he might want to invest in some companies and REITs which could give him a yield of 6 to 10% per annum.  This took into consideration his risk averse personality and the current high prices of stocks. I believe that investing in some companies and REITs with strong fundamentals and high yields would be best for him. I also impressed upon him that these companies and REITs could see their share prices fluctuate but since he is investing for income, he should not have to worry too much about the day to day fluctuations in price.  This is a big advantage of this strategy.


How much could he afford to invest?  After doing some calculations with him, setting aside some money for emergencies and daily expenses which amounted to several months of his salary from active employment, he had a capital of about $100k to invest with. I suggested a basket of REITs and companies which he could invest in when prices next pull back (as prices do not usually go up in a straight line). Even then, don't put in all his money at one go but split his funds into 4 or 5 tranches.  This is hedging in case prices do fall lower.  If he has some knowledge of TA, he would be able to spot supports and trends and would be able to decide if he should pump in more funds each time prices fall or if he should wait.  So, learn some TA, he shall.

After saying all these, he was quite pleased but at the back of his mind, there remained a nagging thought that he could grow his $100k to $500k in the next 10 to 20 years if he traded actively. I simply smiled and told him to go learn TA and trading strategies.  There are courses, websites and blogs aplenty.  Could I not teach him? I told him honestly that I am not a very good trader. I use a combination of FA and TA, FA to spot undervalued stocks and TA to spot entry and exit prices. The high yield counters I am vested in could possibly go higher in price as they are mostly undervalued.  I am quite confident and comfortable with my approach. It might or might not be for him.

I also suggested that he could simply wait for the next crash before going into the market. Buy at a time when there is abject pessimism and when most have given up on the market. Is it that simple? Well, it could be, I said. Why bother to trade actively (especially if we are not very good at it)? Just save his money and continue saving as much of his monthly salary as he could.  When the next crash comes, he would be ready.  Load up then and get ready to see his wealth double ... or even triple.

The Chinese have a saying that "one type of rice feeds a hundred types of people". There are many strategies to wealth building and we simply have to find a strategy that works for us.  Age and how much money we have to start out with have a part to play, perhaps, but I believe that ultimately, we must be able to sleep well at night with our decisions in life.

Related posts:
Risks and rewards: TA and FA.
Excuse me, are you an investor?
Seven steps to creating passive income from the stock market.


Monthly Popular Blog Posts

All time ASSI most popular!


Bloggy Award